One of the ways JavaScript developers debug their code is by using console.log to figure out what the output of a particular variable or condition is. But, what if there is a better way of using this function to give us a better developer experience?
The popular methods to use console.log may look something like this.
const blogger1 = {name : "mycodinghabits", occupation : "software developer", interest : "dancing"}
const blogger2 = {name : "victoria lo", occupation : "web developer", interest : "collecting quotes"}
const blogger3 = {name : "bolaji ayodeji", occupation : "JAMStack developer", interest : "sharing knowledge"}

console.log(blogger1)
console.log(blogger2)
console.log(blogger3)
And the output on the web browser is
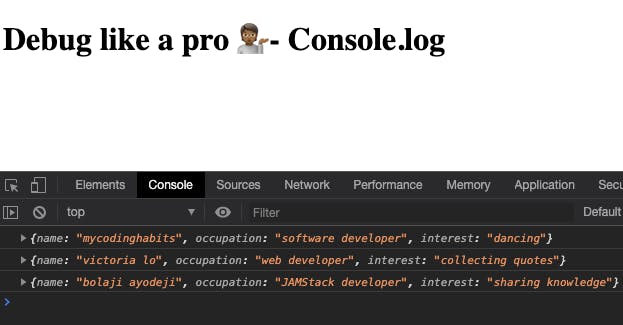
From that log we arent sure who is blogger1, 2 or 3. This is where we can start to do more with console.log. To make this more readable which in turn increases developer happiness, we can do this instead
console.log({blogger1, blogger2, blogger3})
which gives us a better output with our variable names.

Or even better, if our object has the same properties we can use.
Console.table
// TO SEE THE OBJECTS IN AN ARRAY
console.table([blogger1, blogger2, blogger3])

// OR TO SEE THE OBJECTS WITH THEIR VARIABLE NAMES ASSIGNED
console.table({blogger1, blogger2, blogger3})
This gives us
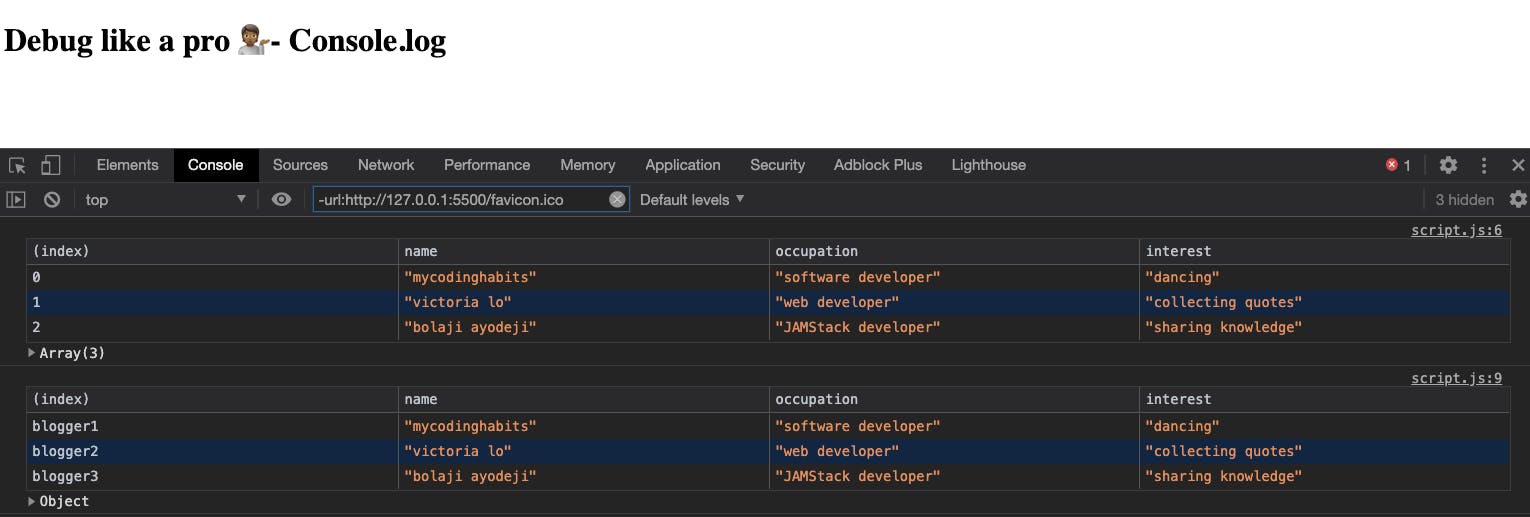
The first example is useful when you have
- an array of objects
and the second when you have
- objects embedded in another object.
Thats cool, but whats even cooler is if I wanted to log performance of a piece of code which iterates over an array of my objects, I can do this using console.time.
Console.time
In this example, I am trying to compare the performance of using maps instead of for loops. Check out all I had to say about this in this article
const blogger1 = {name : "mycodinghabits", occupation : "software developer", interest : "dancing"}
const blogger2 = {name : "victoria lo", occupation : "web developer", interest : "collecting quotes"}
const blogger3 = {name : "bolaji ayodeji", occupation : "JAMStack developer", interest : "sharing knowledge"}

let array0fObjects = [blogger1, blogger2, blogger3];

//COMPARING PERFORMANCE USING LOOPS AND HIGHER ORDER FUNCTIONS LIKE MAP

// USING LOOPS
console.time("timer for loops")

for(i = 0; i < array0fObjects.length; i++) {
    console.log(`%c Hi ${array0fObjects[i].name}`, "color: green; font-weight: bold; background-color: black")
}

console.timeEnd("timer for loops")

//USING MAP
console.time("timer for maps")

array0fObjects.map(v => console.log(`%c ${v.name} likes ${v.interest}`, "color: yellow; font-weight: bold; background-color: black"))

console.timeEnd("timer for maps")
The output
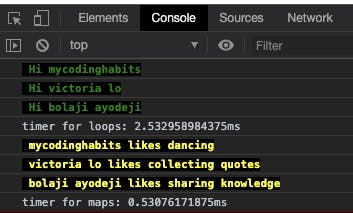
Bonus - Here you can see that my console logs are prettier, this is because the string formatting I applied using the %c allows me to add styling like you would do in css. Try it!
Console.trace
Have you ever had a bug in your code and wanted to figure out where in your code execution your function was being called? Great! We can use console.trace to do this.
const loopBloggers = () => {
    for(i = 0; i < array0fObjects.length; i++) {
        console.log(`%c Hi ${array0fObjects[i].name}`, "color: green; font-weight: bold; background-color: black")
    }

    //Show me their LIKES!
    mapBloggers();
}

const mapBloggers = () => {

    console.trace("I was called here")

    array0fObjects.map(v => console.log(`%c ${v.name} likes ${v.interest}`, "color: yellow; font-weight: bold; background-color: black"))
}

loopBloggers();

Keeping in mind that the call stack follows a Last In, First Out Principle, and in this case loopBloggers was pushed into the stack first followed by mapBloggers.
Console.assert
If you want a fancy way of logging errors from your conditinal statements in Javascript, you can use console.assert to do this.
let isPostHelpful = true;

 if(isPostHelpful == true){
    console.log("%c Please share or react to it 👏🏾",
                "color: black; font-weight: bold; background-color:yellow")
 }
 else{
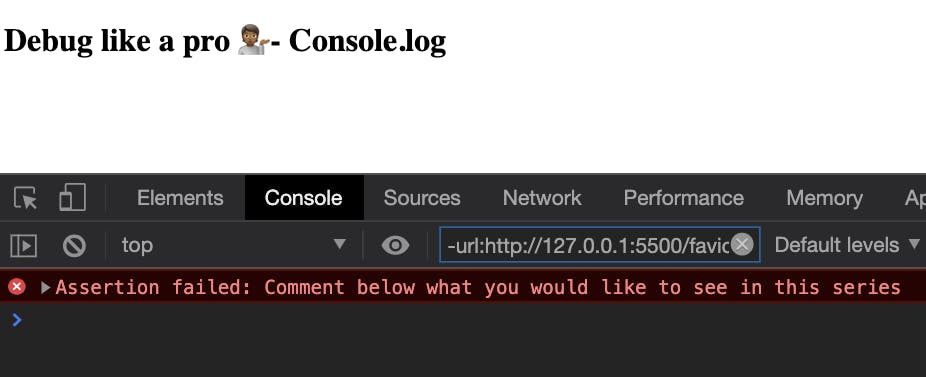
     console.assert(false, "Comment below what you would like to see in this series")
 }
isPostHelpful == true

isPostHelpful == false
If you want to take your debugging skills to an even higher level, you can use the browser debug tools as demonstrated here.
BONUS - If doing that doesn't help maybe the LOGIC is wrong, consider rubber ducking. This is a technique that is used to work through your code line by line by telling a rubber duck what you think your code should be doing. That way you might find flaws in your logic or your code.

Thank you for reading! Hope you learn something new! Like, share, react to the post so others can see it.

